Quick Answer: How Do Gantt Charts Help Production Scheduling?
Gantt charts help production schedulers see jobs, resources, timing, and constraints in one view. In manufacturing, that visibility helps teams spot bottlenecks, adjust sequences, communicate priorities, and protect due dates. When Gantt charts are part of APS software, planners can test schedule changes before they affect machines, labor, materials, and customer orders.
In practice, visual production scheduling gives planners a shared view of what is running, what is late, and what needs attention next. As a result, teams spend less time searching through spreadsheets and more time improving the schedule.
Advanced Planning and Scheduling (APS) Software that use Gantt charts help schedulers see production work by resource, time, and priority. Therefore, planners can make faster decisions about sequence changes, capacity conflicts, and late orders.
The Benefits of Using Gantt Charts in Production Scheduling
In short, Gantt charts improve production scheduling by turning the schedule into a visual timeline. Instead of reading long lists of work orders, planners can see jobs, resources, durations, and dependencies in context.
For manufacturers, the main benefits are:
- Increased visibility
- Clearer shop-floor communication
- Better schedule efficiency
- Stronger accountability
- Faster monitoring of WIP and capacity
- Early alerts for material or capacity problems
1) Increased Visibility Across Jobs and Resources
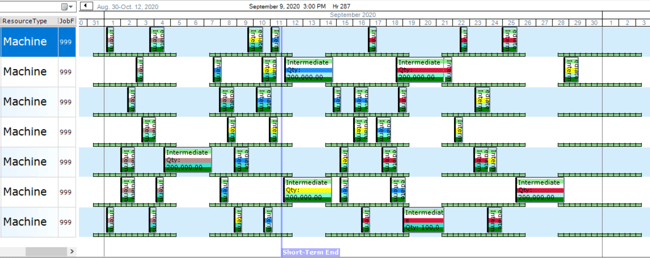
Gantt charts show production work as activity blocks on a timeline. For example, each row can represent a machine, labor group, work center, or production line.
For a neutral software reference, Microsoft describes the Gantt Chart view as a way to list tasks and show their relationship to the schedule using Gantt bars.
As a result, planners can see which jobs are running, which jobs are waiting, and where capacity is tight. The length of each block also shows how long the operation should take. Therefore, long jobs, overloaded resources, and open gaps are easier to spot.
2) Clearer Communication With the Shop Floor
Visual production scheduling and Gantt charts help planners, supervisors, and shop-floor teams work from the same schedule. As a result, that shared view reduces confusion about job order, priorities, and next steps.
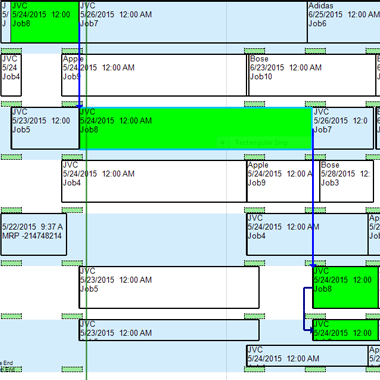
For example, activity links can show how WIP moves from one resource to another. Then operators can see where the job came from, where it goes next, and why a change matters.
3) Better Schedule Efficiency and Production Flow
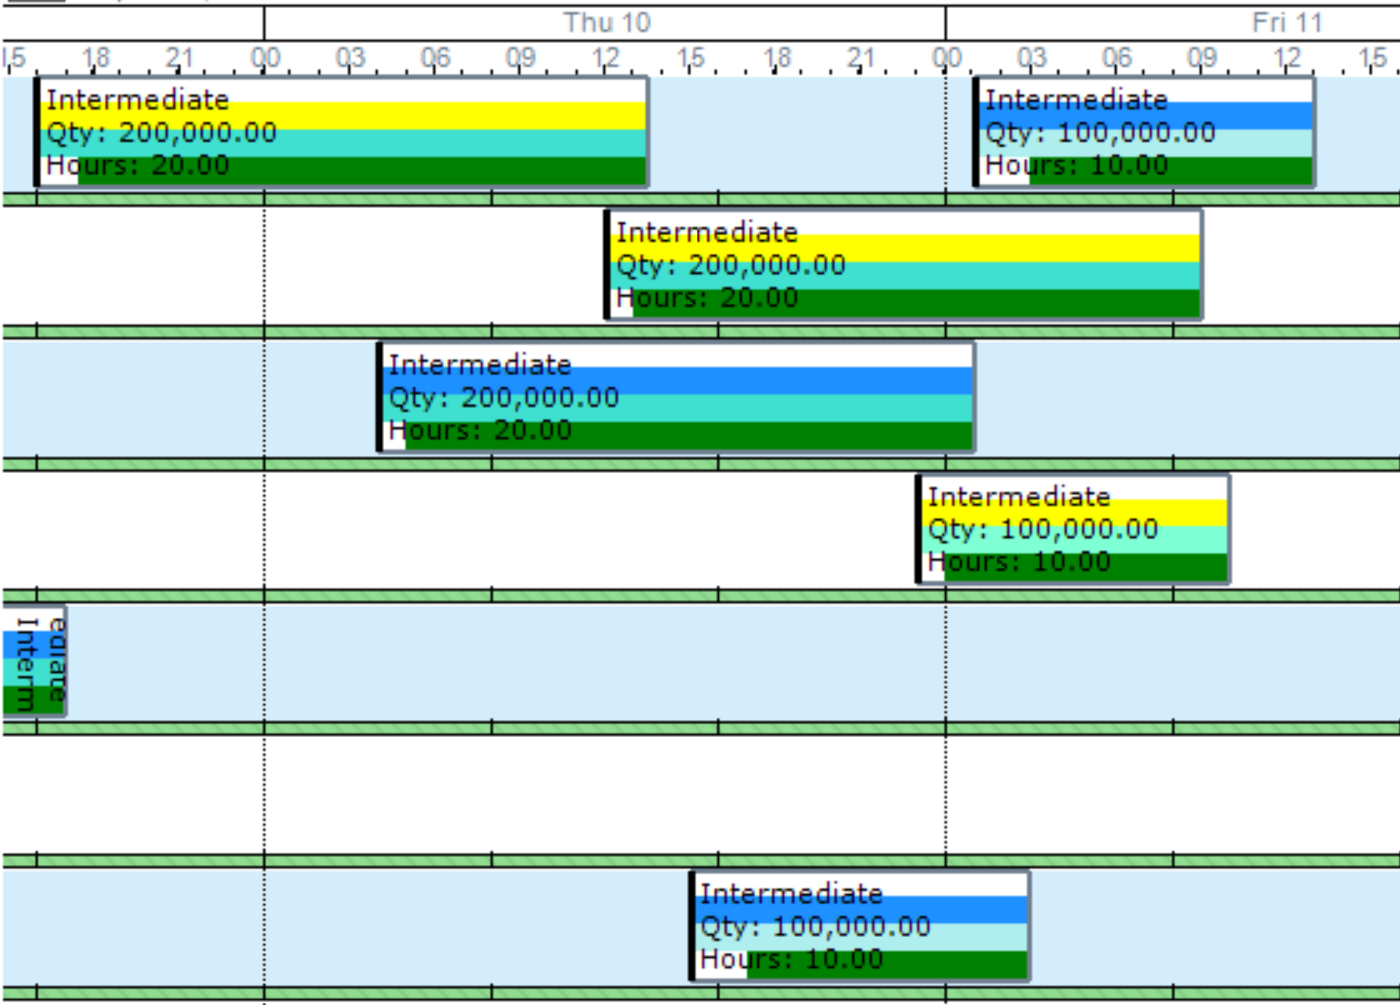
In practice, Gantt charts help planners improve flow by showing where time is lost. For example, they can reveal idle time, long setup windows, overloaded resources, and poor job sequences.
Because of that, planners can adjust the schedule before small delays become larger problems. In APS software, those changes can also account for machine capacity, labor, materials, and changeovers.
4) Stronger Accountability by Resource, Machine, or Team
In addition, Gantt charts reduce responsibility confusion. For example, each resource row shows who or what is assigned to the work, and each activity block shows the planned timing.
As a result, supervisors can review work by department, machine, or operator. They can also check whether actual production follows the plan.
5) Faster Monitoring of WIP, Capacity, and Schedule Status
Also, Gantt charts help managers monitor WIP, capacity, and schedule status without digging through separate reports. Therefore, this is useful when priorities change during the shift.
For example, a planner can see whether a late job is blocked by capacity, materials, or sequence timing. Then the team can focus on the issue that is actually delaying the order.
6) Impact Alerts for Capacity and Material Problems
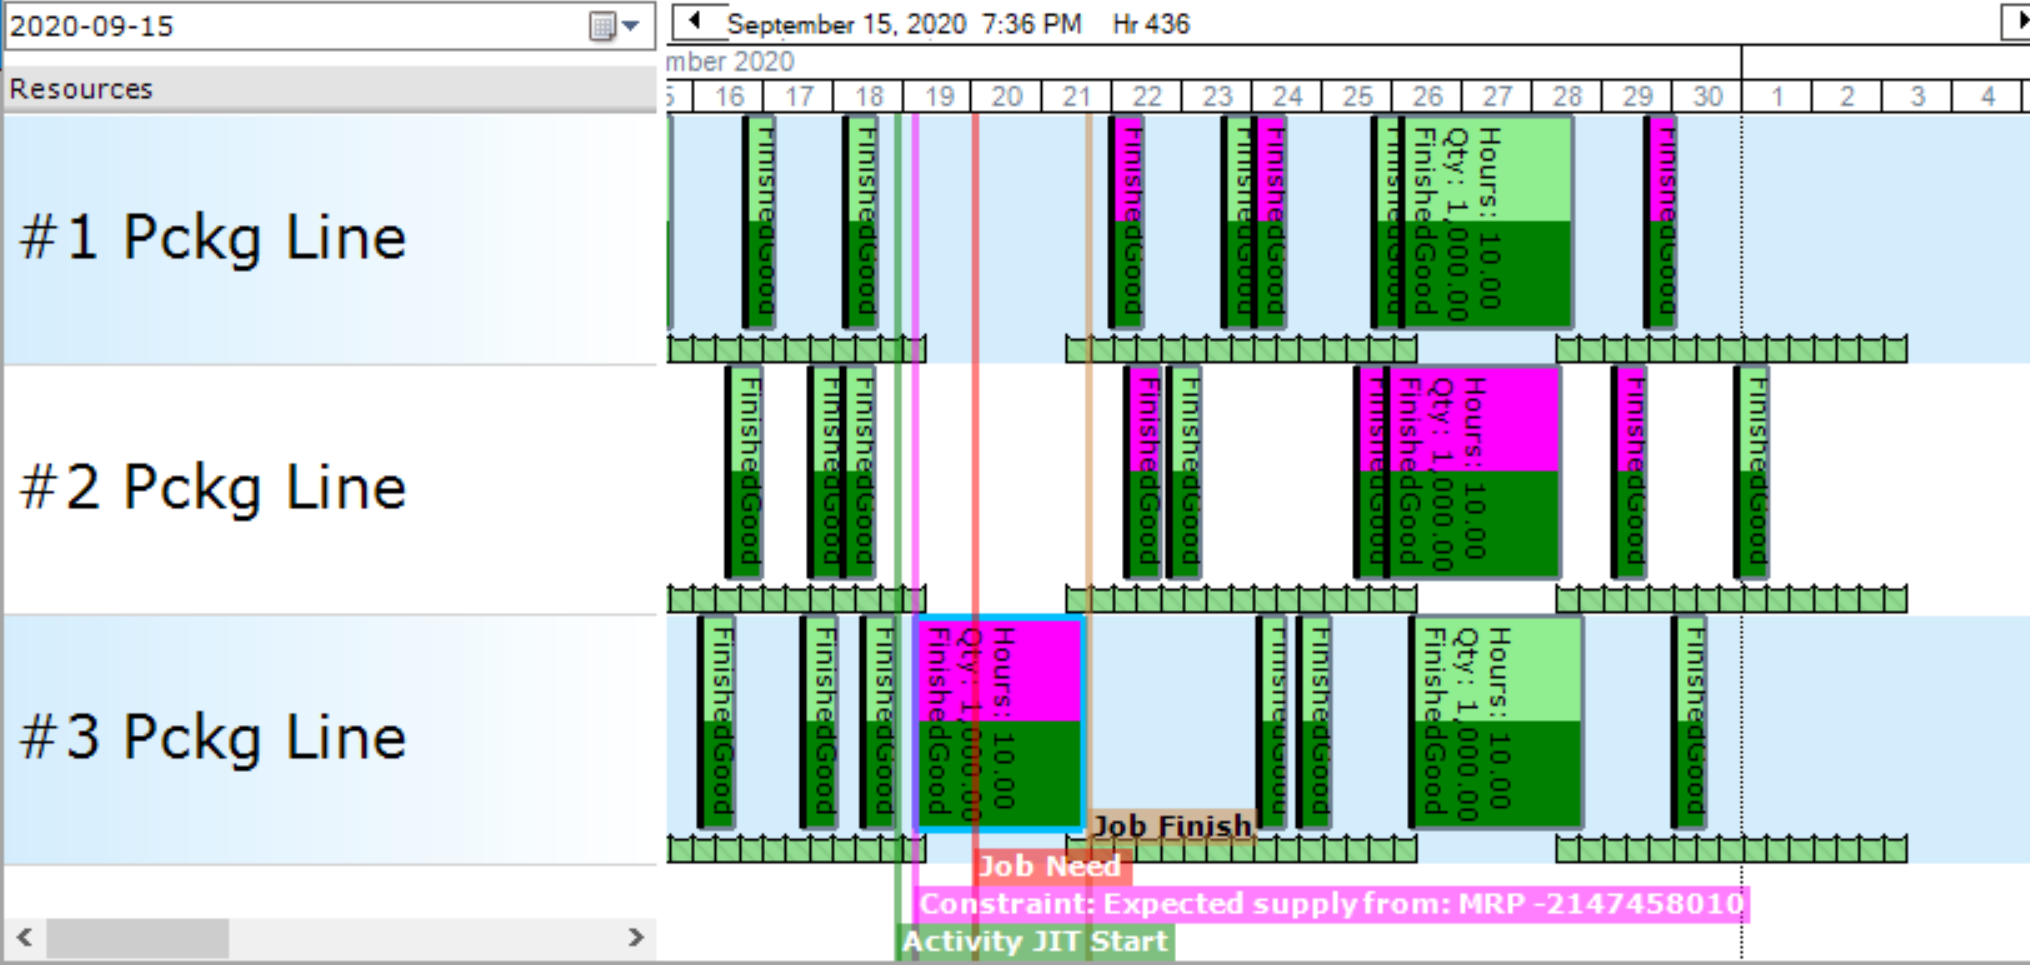
Finally, impact alerts help planners see the effect of a schedule change before they commit to it. For example, late jobs, material shortages, and capacity problems can appear directly on the Gantt chart.
PlanetTogether’s advanced Gantt labels allow planners and schedulers to identify whether you will have late jobs due to capacity constraints or due to material constraints. Therefore, planners can act before a missed due date becomes a customer-service problem.
PlanetTogether's Advanced Planning and Scheduling software (APS) gives manufacturers a visual way to review production work, move activities, and understand schedule impact. This helps teams reduce waste, protect capacity, and improve day-to-day scheduling decisions.
PlanetTogether is easier. Color-coordinated functionality makes the schedule simple to scan, and data is easily modified to fit our specific needs. I can look at my screen and know exactly when we’re running decaffeinated coffee. I know when jobs will be late, on time, case quantities. I see everything on one screen.
JAIME OZUNA, PRODUCTION SCHEDULER, ATLANTIC COFFEE
In addition, Drag & Drop functionality gives planners a faster way to test changes. When an activity block is moved in the Gantt, the schedule can adjust around that change. As a result, planners do not have to move each block one by one.
Decision Framework: When Should Manufacturers Use a Gantt Chart?
In general, use a Gantt chart when the schedule needs to show timing, resource load, and job sequence in one place. Also, it is especially useful when planners must explain schedule changes to supervisors, customer service, maintenance, or the shop floor.
- Use a Gantt chart when: jobs compete for the same machines, labor, or materials.
- Add APS when: planners need finite-capacity logic, what-if testing, and constraint-aware sequencing.
- Do not rely on a basic Gantt chart alone when: the plant has frequent rush orders, changeovers, or material shortages.
Advanced Planning and Scheduling Software
Advanced Planning and Scheduling (APS) software helps manufacturers turn visual schedules into executable plans. For example, instead of showing only dates and tasks, APS can plan around capacity, labor, materials, setup rules, and due dates.
APS Systems can be quickly integrated with an ERP/MRP software to fill the gaps where these systems lack planning and scheduling flexibility, accuracy, and efficiency. Therefore, planners can use ERP data while improving schedule realism.
With PlanetTogether APS you can:
- Create optimized schedules that balance production efficiency and delivery performance
- Maximize throughput on bottleneck resources to increase revenue
- Synchronize supply with demand to reduce inventories
- Provide company-wide visibility to resource capacity
- Enable scenario data-driven decision making
Implementing APS software with ERP and MES integrations helps manufacturers use ERP data to build more realistic production schedules. As a result, it also helps planners respond faster when constraints change.
Drag-and-Drop APS Gantt Charts for Production Scheduling
This video shows how production planners and schedulers can use drag-and-drop Gantt charts inside PlanetTogether APS. It focuses on visual production scheduling, schedule changes, and real-time impact analysis.
Instead of rebuilding plans by hand, teams can move jobs, review conflicts, and adjust the schedule faster. Therefore, planners can respond to late orders, capacity constraints, and changing priorities with more control.
For manufacturers using advanced planning and scheduling (APS), Gantt charts help connect daily scheduling decisions to finite capacity scheduling, material availability, and on-time delivery goals. PlanetTogether APS gives teams a visual way to compare options before changes reach the shop floor.
Where Poor Planning Creates Hidden Manufacturing Costs
Gantt charts give schedulers a clearer view of work, resources, and timing. However, visibility alone does not solve every planning problem. Teams also need to understand where schedule gaps create real cost.
Download our Planning and Scheduling Infographic to see how weak planning can affect profit, capacity, delivery, and labor. The infographic breaks down common cost drivers that manufacturers often miss until they appear as late orders, rush shipments, or excess inventory.
For teams evaluating advanced planning and scheduling (APS), this resource also shows why better planning logic matters. PlanetTogether APS helps manufacturers turn schedule data into faster decisions, cleaner sequencing, and stronger delivery performance.
In this infographic, you will learn how poor planning can lead to:
- Lost sales from late deliveries and long lead times
- Capacity loss from inefficient sequencing and changeovers
- Higher overtime during bottleneck periods
- Rising inventory carrying costs from early material buys
- Expedited shipping costs when orders run late
Download the Money Is in the Planning infographic.
Gantt Charts in Production Scheduling FAQ
What Is a Gantt Chart in Production Scheduling?
A Gantt chart in production scheduling is a visual timeline that shows jobs, resources, and planned run times. In manufacturing, it helps planners see what is scheduled, where work is queued, and which resources may become overloaded.
How Do Gantt Charts Help Production Planners?
Gantt charts help planners see job sequence, capacity conflicts, and schedule changes in one view. As a result, they can adjust work before delays affect due dates or shop-floor priorities.
Are Gantt Charts Enough for Finite Capacity Scheduling?
A basic Gantt chart is not enough for finite capacity scheduling. It shows the plan, but APS software adds constraint logic for machines, labor, materials, changeovers, and due dates. Cambridge IfM explains that finite capacity scheduling builds the schedule around available capacity from the outset.
What Is the Difference Between a Gantt Chart and APS Software?
A Gantt chart is a visual schedule. APS software uses planning logic to create and adjust that schedule around real constraints. Therefore, APS makes the Gantt chart more useful for production decisions.
When Should a Manufacturer Use Gantt Charts?
A manufacturer should use Gantt charts when planners need to see job timing, resource use, and sequence conflicts. They are most useful when many jobs compete for the same machines, people, or materials.
See PlanetTogether APS Gantt Scheduling in Action
Want to see how a constraint-aware Gantt schedule works in a real production environment? Request a PlanetTogether APS demo to see how planners use visual scheduling, finite capacity, and what-if planning to protect delivery dates.