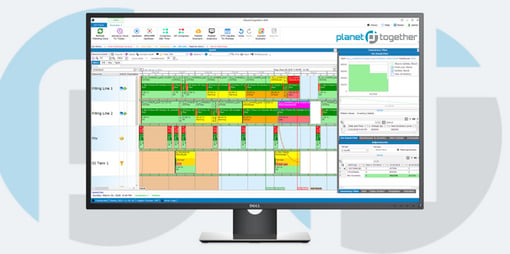
Visual Analytics in Medical Manufacturing: Unlocking Production Flow Visibility with APS Integration
In medical manufacturing, where compliance, quality, and precision are non-negotiable, Plant Managers are tasked with orchestrating highly complex production environments. From sterilization processes and assembly lines to packaging and final inspection, any inefficiency can ripple through the system—jeopardizing delivery timelines, increasing costs, or worse, risking patient safety.
To meet these challenges, forward-thinking Plant Managers are turning to Visual Analytics for Production Flow Mapping. Visual analytics offers a dynamic, intuitive lens into manufacturing operations, enabling real-time tracking, bottleneck identification, and proactive planning.
When integrated with advanced planning and scheduling (APS) systems like PlanetTogether, and connected to ERP platforms such as SAP, Oracle, Microsoft Dynamics, Kinaxis, or Aveva, visual analytics becomes a powerful enabler of lean, compliant, and efficient operations.
What is Production Flow Mapping in Medical Manufacturing?
Production flow mapping refers to the real-time visualization of each step involved in transforming raw materials into finished medical products. This includes:
Component preparation and sterilization
Subassembly and assembly operations
Quality control checkpoints
Packaging and labeling
Logistics and shipment preparation
Mapping this flow visually helps Plant Managers understand how each process interacts with the next and how materials, labor, and time are being utilized throughout the plant. It also highlights dependencies and delays that may otherwise remain hidden in spreadsheets or siloed systems.
Visual Analytics: A Game Changer for Plant Managers
Traditional methods of production analysis—manual logs, static charts, and ERP-generated reports—fall short in today's dynamic manufacturing environment. Visual analytics, on the other hand, empowers Plant Managers with:
Real-time dashboards showing work-in-progress, downtime, and throughput
Interactive flow diagrams that help isolate and resolve bottlenecks
Heat maps and alerts for deviations from standard operating procedures
Predictive insights into labor utilization, equipment load, and maintenance needs
By incorporating data from across your ecosystem, visual analytics ensures that your shop floor isn’t just visible—it’s understandable and manageable.

The Role of PlanetTogether in Enabling Visual Flow Mapping
PlanetTogether APS is purpose-built to optimize production scheduling and sequencing. But its impact grows exponentially when it feeds real-time visual analytics.
When PlanetTogether is integrated with ERP systems like SAP, Oracle, Microsoft Dynamics, Kinaxis, or Aveva, it becomes the central engine for synchronizing planning, execution, and analysis. Here’s how:
Data Unification and Flow Visualization
PlanetTogether pulls order data, routing, BOMs, and inventory status from ERP systems. Visual analytics tools can then display:
Current vs. planned production timelines
Material shortages affecting flow
Real-time machine and operator status
Forecasted vs. actual production metrics
This provides a full-spectrum, visual map of your production flow from upstream supplier inputs to final product delivery.
Dynamic Rescheduling and Reoptimization
In a regulated environment, delays in one stage (e.g., QC failures or sterilizer downtime) can cause a chain reaction. PlanetTogether APS can reschedule production automatically. Visual analytics immediately reflects these changes, giving the Plant Manager and floor supervisors clear visibility into adjusted workflows.
Visual Bottleneck Identification
With the APS engine continuously analyzing constraints, visual dashboards highlight chokepoints—whether it's a congested assembly area, a quality control backlog, or a packaging line slowdown. This real-time visibility allows Plant Managers to redeploy resources before issues cascade.
Compliance and Traceability
Medical manufacturing demands traceability for audits and patient safety. Visual analytics tools integrated with PlanetTogether and your ERP can trace every product’s journey, highlighting rework loops, non-conformities, or areas requiring procedural review.

Integration Benefits: Beyond Visibility
Integrating PlanetTogether with ERP systems and visual analytics provides benefits that go far beyond pretty dashboards:
Improved Throughput: Real-time awareness and agile reoptimization prevent stoppages and maintain continuous flow.
Shorter Lead Times: Quicker identification and resolution of delays improve delivery performance.
Higher OEE: Better equipment utilization through bottleneck visibility and dynamic scheduling.
Audit-Readiness: Built-in traceability and compliance records tied to production maps.
Cross-Functional Alignment: Shared dashboards between production, quality, and procurement teams drive coordinated action.
Key Capabilities to Look For in Your Visual Analytics Stack
To maximize value, Plant Managers should ensure their visual analytics platform offers:
Customizable dashboards that reflect your plant’s unique workflow
Drill-down capabilities for investigating anomalies in flow
Mobile and tablet access for use on the shop floor
Predictive analytics to forecast delays or failures
Integration with PlanetTogether APS and your chosen ERP platform (e.g., SAP, Oracle, Microsoft, Kinaxis, or Aveva)
From Plant Oversight to Plant Intelligence
For Plant Managers in medical manufacturing, visual analytics is more than a modern convenience—it's a necessity for navigating complexity, compliance, and continuous improvement. When powered by PlanetTogether’s APS capabilities and integrated with robust ERP systems like SAP, Oracle, Microsoft, Kinaxis, or Aveva, visual analytics transforms your shop floor into a responsive, agile, and intelligent operation.
Whether you're responding to a recall risk, ramping up production on a new device, or simply trying to eliminate inefficiencies, production flow mapping through visual analytics is your new operational superpower.
Need help mapping your production flow with PlanetTogether and visual analytics?
Let our team show you how to unify your planning and visualization tools for smarter, faster manufacturing decisions.